projects

Philips Hue Light Panel

Since the beginning of the pandemic, I have been spending more time working from home. It quickly became apparent that the lighting in my work area was somewhat dark and uneven, which was causing me additional eye strain. To fix this, I wanted to add some sort of light panel in front of my desk that could provide even lighting over my work area. Ideally, I wanted something that would allow me to change the light color and brightness to suit my mood. Even better, I wanted something that could connect to my home automation system so I could integrate it with my current smart home setup.

I looked at a number of solutions but could not find exactly what I wanted. While there are large LED panels on the market today, most are ceiling lights that are intended to be wired directly into the electrical system. Another solution would be to position multiple lights in around of my desk, but this would take up space and could still result in some odd shadowing. As I couldn’t find anything I liked, I decided to build my own light panel using Philips Hue lightstrips.

For this project, I used 160 inches of Philips Hue color ambiance lightstrips (one base kit plus two extensions), although it would be possible to use any type of LED lightstrip. Although the Hue lightstrips are expensive, they seamlessly integrate with most home automation systems. They occasionally go on sale, so I was able to buy them for a decent price.

The first part of building the light panel was to figure out what type of enclosure to use. The enclosure needed to be deep enough to allow for effective diffusion of the lights inside. After some searching, I found an 18″ x 24″ shadow box with a 1.5″ depth, which seemed to be roughly the size I wanted.

The shadow box frame used four wood supports to anchor a sheet of glass in the front. I simply removed the staples from the sides and gently pried the supports from the frame, which allowed me to remove the glass. I then stripped the black lining from the side supports and painted them white so that they would reflect light inside of the frame. The backing board of the shadow box had a foam layer for pinning items to the back of the frame. This would not be ideal for mounting the lightstrips so I stripped off the foam layer and painted the board white.

It didn’t look like this in real life…

The next step was to find the right diffusing material to use in place of the glass. I ordered samples of different light diffusing acrylics to see how they performed at the frame depth. Ultimately I decided on Acrylite Satinice White as the best diffuser for my purposes. I ordered a custom cut piece to fit the shadow box frame. Once it arrived, I slid the acrylic into the frame, glued the frame supports in with Gorilla Glue, and nailed some small tacks in for additional support. I then clamped down the supports and let the glue dry overnight.

The next step was to mount the lightstrips to the backing of the frame. I experimented with different methods of attaching the lightstrips to the backing board. I quickly learned that the Hue lightstrips are fragile and can break if you are not careful. My first strategy was to cut the lightstrips and re-attach them with Litcessory extension connectors so that the lightstrip segments would lay flat. This ended up being a costly mistake as the connectors were very finicky and would often not connect all of the pins correctly, which made chaining multiple segments very problematic. I then decided to leave the remaining lightstrips intact and simply zig-zag them on the backing board. This solution meant that areas of the lightstrip would not lay flat, which could result in uneven diffusion on the edges. I used hot glue to support the lightstrips in areas where they lifted off of the backing. I then covered the lightstrips with a thin layer of light diffusing fabric to even out the diffusion over the raised areas. Ultimately, this simpler solution seemed to be the best.

The last step was to drill a hole in the bottom of the shadow box frame so I could connect the Hue power cord. I then simply replaced the backing on the shadow box frame and hung my new light panel.

So blue!

I am pleased with the outcome of this project. As it integrates with my home automation system, I can configure the light panel to match the ambiance of the room, change colors for specific notifications, or even to turn off as a reminder that it’s time to be done for the day.

Raspberry Pi Weather Display

While going through some old project components, I found a cute little case for a Raspberry Pi and a TFT screen. Instead of allowing it to collect more dust, I decided to try to make something useful with it. The small size was perfect for some sort of informational display, so I decided to turn it into a weather display to keep by the door to remind me to take a coat or umbrella.

Finished Raspberry Pi weather display!

The display case was for a Raspberry Pi Model B (version 1!) and a 2.8″ TFT screen. I was able to find an old Model B and got started.

The first step was to get the PiTFT screen running as I had no idea if it even worked. I first started by installing Raspbian Bullseye on the Raspberry Pi, but was unable to get anything to display on the screen. After digging in a bit more (and reading the manual), I found that these screens can have issues with Bullseye, but often work on Raspbian Buster. I tried again with a fresh Raspbian Buster install but still had problems with the display not showing the desktop (but the console worked as expected). I was finally able to get the screen to work by installing Adafruit’s recommended lite distribution and then installing the PIXEL Desktop on it.

I then used the Adafruit Easy Install instructions to set up HDMI mirroring between the Raspberry Pi and an external monitor. It’s a good idea to make any last configurations that require the higher resolution of the monitor before running the easy install script as the HDMI mirroring mode downscales the monitor to 640×480 resolution. This includes disabling any screensavers that could interfere with the display.

Once I had the desktop environment running, I tried out a few Linux desktop apps to see if they would work for my display. Sadly, most of the apps were designed for higher resolution screens which made them difficult to read on the TFT screen. GNOME Weather was almost good enough, but its lack of an auto-refresh feature made it infeasible for my project.

Close but no cigar: GNOME Weather on a Raspberry Pi

My next option was to build my own weather display application. I decided to use the OpenWeatherMap API as their free version had all of the data I needed and their free subscription tier had enough request quota for my purposes. I also wanted a set of icons for my display and found the open source weather-icon project, which contains icons for almost any weather condition imaginable (including aliens!)

Once I had the data for the project, I started investigating how to build a graphical user interface for the display. After a false start with Python Tkinter, I decided to use Pygame. This was my first time using Pygame (or any Python GUI toolkit for that matter) but it was relatively easy to make progress with it. Although this framework is tailored towards building games, I found it to be quite effective for building the GUI for this project. After a bit of tinkering, I was able to build a customizable weather application for small displays. The code is available here.

I then copied my code over to the Raspberry Pi and was able to see the screen in action! I made a few small display tweaks and then configured autostart to run the display program on startup.

Raspberry Pi weather display by the door

And that’s it! I now have a neat little weather display by my door and I was finally able to use some parts that I bought eight years ago!

Sound Sensitive Earrings

I made these sound sensitive earrings as something blinky to wear while volunteering at the New York City Girls Computer Science and Engineering Conference. These earrings are a fun example of something interesting you can make with some basic computer science and electronics skills. This project is a mash-up of two Adafruit projects: the Gemma hoop earrings and the LED Ampli-Tie. They can easily be assembled in a few hours.

To start, you will need two Gemma microcontrollers, two NeoPixel 16 pixel rings,  two microphones, two small rechargeable batteries, some wire, some jewelry findings, double stick tape, electrical tape and soldering tools. Make sure that you also have a charger for the rechargeable batteries. It’s also a good idea to paint the front of the microphone board black so that it blends in better with the electronics.

earrings_soldered

These earrings are assembled similarly to the Gemma hoop earrings with the additional step of attaching the microphone. First, start by attaching the LED ring to the Gemma. Connect the IN pin on the LED ring to the Gemma’s D0 pin and connect the LED ring’s V+ and G pins to their respective 3Vo and Gnd pins on the Gemma. Next, attach the microphone. It’s a good idea to place black electrical tape on the back of the microphone board before assembly to help prevent any shorts. Connect the microphone’s OUT pin to the Gemma’s D2 pin and connect the microphone’s VCC and GND pins to their respective 3Vo and Gnd pins on the Gemma. Be sure to run the microphone’s GND wire under the microphone so that the wire is concealed. Solder everything in place.Once the earrings are soldered together, it’s time to program them! I used a modified version of the Ampli-Tie sketch (available on the Adafruit site). I made a few minor modifications, such as changing the pins, removing the tracer dot, and adding a reverse mode so that the earrings can light up in opposite directions.

Earrings_bb

Next, attach the battery to the back of the Gemma with double stick tape. I also used a permanent marker to color the red battery wires black. Black electrical tape can be used to secure the battery and battery wires to the back of the LED ring and microcontroller.

Finally, attach the earring hooks to the LED ring. I simply attached small O-rings to the OUT pin of the LED ring and then attached the earring hooks with another small O-ring. And that’s it – turn on the Gemma and you are good to go! I found that my 150 mAh battery lasts for about four hours 🙂

Osgood’s Scarf

This year for Halloween I decided to dress up as one of my favorite minor Doctor Who characters: Petronella Osgood, the geeky UNIT scientist with a Zygon double. One of Osgood’s outfits includes a scarf similar to Tom Baker’s iconic neckwear but differs in color and knitting style. Being a knitter and a Doctor Who fan, I was excited to make this scarf!

It took a bit of research to find the exact pattern to use for this project. There is an excellent Ravelry project that details many of the differences in Osgood’s scarf. The pattern mostly follows the Doctor Who Season 13 scarf pattern with a few minor adjustments, such as a varying stripe color, single color tassels, and lighter colors.

For my scarf, I used Rowan Wool Pure DK yarn in Damson, Enamel, Tan, Gold, Parsley, Kiss, and Anthracite (note that as of the time of this post, many of these colors are now discontinued). I cast on 66 stitches on a size US 5 needle and knit the entire scarf in a 1×1 rib stitch with a slipped stitch edge. For the tassels, I used 6 strands of a single color for each tassel.

After many months of knitting, I finished the scarf just in time for Halloween. At completion, my scarf was twelve feet eight inches long (excluding the tassels). I’m very pleased with the finished item and I’m looking forward to wearing it more as the weather turns colder!

Pedestrian Safety in Manhattan

For the final project in my Realtime and Big Data Analytics class at NYU, I worked on an analysis of the effectiveness of pedestrian safety measures in Manhattan with fellow students Rui Shen and Fei Guan. The main idea behind this project was to look at the number of accidents occurring within a fixed distance of an intersection in Manhattan and determine if the accident rate correlated with any features of the intersection, such as the presence of traffic signals or high traffic volume. We used a number of big data tools and techniques (like Apache Hadoop and MapReduce) to analyze this data and found some rather interesting results.

The first step was to collect data about intersections, accidents, and various features of the intersections. To do this, we relied heavily on open source data sets. We extracted the locations of intersections, speed bumps, and traffic signals from OpenStreetMap. We used NYC Department of Transportation data for traffic volume information, traffic signal locations, and traffic camera locations. Finally, we used NYC Open Data for information on accident counts and traffic volume, as well as the locations of speed bumps, arterial slow zones, and neighborhood slow zones. Some of the data could be used mostly off of the shelf, but other datasets required further processing, such as normalizing traffic volume over time and geocoding the street addresses of traffic camera locations.

The next step was to merge the feature and accident data with the relevant intersections. To do this, we used big data tools to assign intersection identifiers to every corresponding feature and accident record. As Hadoop can’t natively handle spatial data, we needed some additional tools to help us determine which features existed within an intersection. There were three distinct types of spatial data that we needed to process: point data (such as accidents), line data (such as traffic volume) and polygon data (such as neighborhood slow zones). Fortunately, GIS Tools for Hadoop helped us solved this problem. The GIS Tools implement many spatial operations on top of Hadoop, such as finding spatial geometry intersections, overlaps, and inclusions. This toolkit also includes User Defined Functions (UDFs) which can be used with Hive. For this task, we used Hive and the UDFs to associate the feature and accident data with the appropriate intersections. We experimented with different sizes of spatial buffers around an intersection and decided that a twenty-meter radius captured most of the related data points without overlapping with other intersections.

Examples of the different types of spatial data we had to correlate with intersections: area data (blue), point data (red) and line data (green).
Examples of the different types of spatial data that could exist within an intersection: area data (blue), point data (purple) and line data (green).

Once all of the relevant data had an intersection identifier assigned to it, we wrote a MapReduce job to aggregate all of the distinct data sets into one dataset that had all of the intersection feature information in a single record. In the reduce stage, we examined all of the data for a given intersection and did some further reduction, such as normalizing the traffic volume value for the intersection or calculating the sum of all of the accidents occurring within the intersection buffer.

The last step was to calculate correlation metrics on the data. To do this, we used Apache Spark. We segmented the data set into thirds by traffic volume, giving us low, moderate, and high traffic volume data sets.  We then calculated Spearman and Pearson correlation coefficients between the accident rate and the individual features and then analyzed the results. Although most features showed very little correlation with the accident rate, there were a few features that produced a moderate level of correlation. First, we found that there is a moderate positive correlation between accidents and the presence of traffic lights. This seemed odd at first but on second consideration it made sense. I have seen many random acts of bravery occur at traffic signals where people would try to cross the street just as the light was changing. Second, we found that there was a moderate negative correlation between high traffic volume and accidents. Again, this was not immediately intuitive, but our speculation was that drivers and pedestrians would be more cautious at busy intersections.

As this project was only a few weeks long, we didn’t have time to do a more in-depth analysis. I think we would have found even more interesting results had we done a better multivariate analysis which would allow us to calculate correlation metrics across all variables instead of just examining single variant correlation. One observation that we made was that intersections in high-traffic business or tourist areas have different accident profiles than intersections in residential areas. Therefore, it would be wise to include more socio-economic information for each intersection, such as land-use information and population information.

Despite the time constraints, the small amount of analysis we did was very interesting and made me look at something as simple as crossing the street in a whole new light.

Live Streaming Video With Raspberry Pi

IMG_0320

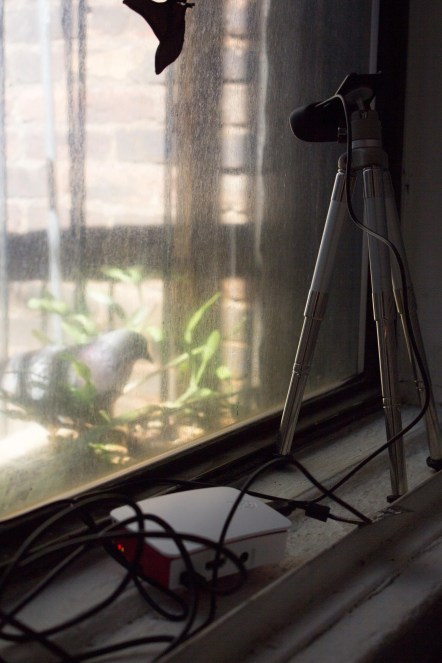
Much to my delight, I discovered that a pair of pigeons are nesting outside of my window. I decided to set up a live streaming webcam so I can watch the young pigeons hatch without disturbing the family. Instead of buying an off-the-shelf streaming solution, I used a Raspberry Pi and a USB webcam. Here is how I set up live streaming video using my Pi and Ustream.

For this project, I used a Raspberry Pi Model B+, a USB WiFi adapter, a microSD card, a USB webcam and a 5 volt power adapter. When selecting a USB webcam, try to get something on the list of USB webcams known to work with Raspberry Pi. It will save you a lot of headaches in the long run!

IMG_0319

To start, download the latest Raspbian image and load it onto the SD card. My favorite tool for doing this on a Mac is Pi Filler. It’s no-frills, easy to use and free! It may help to connect the Pi to a monitor and keyboard when first setting it up. Once the Pi first comes up, you will be prompted to set it up using raspi-config. At this time, it’s a good idea to expand the image to use the full card space and set the internationalization options to your locale so that your keyboard works properly.

Once the Raspberry Pi boots up, there are a few things that need to be updated and installed. First, it’s a good idea to update the Raspbian image with the latest software. I also like to install webcam software, fswebcam, so I can test that the webcam works before setting up video streaming. Finally, you’ll need ffmpeg, which is software capable of streaming video. The following commands will set up the Raspberry Pi:

sudo apt-get update
sudo apt-get upgrade
sudo apt-get install fswebcam
sudo apt-get install ffmpeg

After installing the software, it’s a good idea to check whether the webcam works with the Raspberry Pi. To do this, simply take a picture with the webcam using fswebcam. This will attempt to take a single photo from the webcam. You can do this by running the following command:

fswebcam photo.jpg

If the photo looks good, then you are ready to set up streaming video. First, set up a Ustream account. I set up a free account which works well despite all of the ads.  Once you set up your video channel, you will need the RTMP URL and stream key for the channel. These can be found in Dashboard > Channel > Broadcast Settings > Encoder Settings.

Next, set up video streaming on the Raspberry Pi. To do this, I used avconv. The documentation for avconv is very dense and there are tons of options to read through. I found this blog post which helped me get started. I then made some adjustments, such as using full resolution video, adjusting the frame rate to 10 frames per second to help with buffering issues and setting the log level to quiet as to not fill the SD card with logs. I also disabled audio recording so I wouldn’t stream the laments of my cat for not being allowed to ogle the pigeons. I wrote this control script for my streaming service:

#!/bin/bash 

case "$1" in 
   start)
      echo "Starting ustream"
      avconv -f video4linux2 -r 10 -i /dev/video0 - pix_fmt yuv420p -r 10 -f flv -an -loglevel quiet <YOUR RTMP URL>/<YOUR STREAM KEY> &
      ;;
   stop)
      echo "Stopping ustream"
      killall avconv
      ;;
   *)
      echo "Usage: ustream [start|stop]"
      exit 1
      ;;
esac

exit 0

Make sure the permissions of your control script are set to executable. You can then use the script to start and stop your streaming service. Before placing the webcam, it’s a good idea to see if you need to make any additional updates to the Raspberry Pi for your webcam to work. The webcam I chose, a Logitech C270, also required some modprobe commands to keep from freezing. Finally, it’s a good idea to add your control script to /etc/rc.local so that the streaming service automatically starts in case your Raspberry Pi accidentally gets rebooted.

And that’s it! There is a multiple second delay to the streaming service so within a minute you should see live streaming video on Ustream. One word of caution on working with the Raspberry Pi: be sure to shut down the Raspbian operating system before unplugging the Raspberry Pi. The SD card can become corrupted by just unplugging it. This will cause the operating system to go into kernel panic and refuse to boot.  Sadly, the only solution for this is to reinstall Raspbian and start all over again.

Once my webcam was up, I found that I had some issues positioning the camera effectively. To solve this, I bought a cheap mini camera tripod. I then dismantled the clip of my webcam and drilled a 1/4″ hole in the plastic so it would fit on the tripod. I put a 1/4″-20 nut on the top of the screw and I was good to go!

IMG_0330

I will be live streaming the pigeon nest for the next month or so on this Ustream channel (Update: the baby pigeons have grown up and left the nest, so pigeon cam has been taken down).  I’ve learned a lot about pigeons by watching them every day. The squabs should hatch during the upcoming week and I am excited to watch them grow!

IMG_0333

DIY LED Strip Controller

On a whim I decided to add LED lighting to my desk hutch. I already had a reel of LED strips but nothing to control them. As I wanted to build a controller that afternoon, I constructed it from parts which could be purchased locally. The controller I made has an on/off switch and two knobs: one to control the brightness and the other to control the color of the lights. Here is how I built it!

This project required the following parts: two 10K ohm potentiometers with knobs, an on/off switch, a project box, a 5 volt power supply, a power jack, some wire, and a small Arduino compatible microcontroller. RadioShack sells the Arduino Micro, but I used a Teensy 2.0 I had on hand as it is a much cheaper alternative. Of course, you also need some programmable LED strips. I used some 5 volt WS2812B LED strips (similar to Adafruit’s NeoPixel strips). It’s also useful but not required to have some connectors for the LED strips so that they can be detached from the controller. I used some JST connectors from my project stash.

The first step is to make holes in the project box. I did this with my trusty Dremel. Drill five holes: two for the potentiometers, one for the power switch, one for the power jack and a one for where the LED strip wires will enter the project box. Once the box is drilled out, place the power switch, potentiometers and power jack into the project box. Solder the power wires to the components.

IMG_9702

Next, I assembled the LED strips. If you are adding connectors to the LED strips, solder those on to the strips. If you’re connecting multiple strips, be sure that you bundle the wires together properly. I’ve found that using colored wire or marking wires with different colors of tape makes it easier to keep everything straight.

IMG_9722

Next, solder the potentiometers and LED strips. Mark the data lines for the LED strip and the potentiometers so you know which wire corresponds to a given component. It makes coding the microcontroller easier.

IMG_9761

Next, solder the microcontroller.  Keep track of the pins and their corresponding data lines. When soldering the potentiomenter to the microcontroller, make sure to connect the potentiometer data wire to pins that can support the analogRead function. These pins generally begin with the letter ‘A’.

IMG_9767

Now it’s time to program the microcontroller. The simple code can be found here. Update the code to reflect the length of your LED strip and the pins that correspond to your components. Be sure to test everything!

IMG_9771

Once you’ve verified that everything works, tape up any solder joints so that there are no shorts. Close up the box and you’re done!

IMG_9772

Knitting

photo 2

I recently taught myself how to knit. I was interested in the mechanics of knitting, especially how it’s possible to weave string into cloth with just a few simple tools and techniques. It was also appealing because it’s something that can be done in small sessions rather than requiring long spans of continuous attention. Furthermore, knitting is a skill that allows you to make really cool things.

Knitting during a flight delay

To get started, I picked up an awesome introductory knitting book, Stitch N’ Bitch. The friendly folks at Knitty City also helped me pick up some needles (size 10) and yarn that were suitable for a beginner.

Scarf

My first project was this simple ribbed scarf. Admittedly, it took me a long time to figure out the purl stitch, but I finally had some success with the English method of knitting. At the beginning, I made some mistakes and had trouble getting the yarn tension right which resulted in some oddities in the knitted fabric. By the end of the scarf, however, the stitches were even and consistent, resulting in a cool stretchable ribbed pattern.

Ribbed fabric

For my second project, I wanted to try something a little harder. I made the Official Kittyville hat. I used a cheap wool yarn so it wouldn’t be an expensive mess if I screwed the whole thing up. This required needles that were smaller (size 7) than the ones I used for my first project. The hat also involved some new techniques, such as knitting in the round, decreasing size, using double-ended needles, and picking up stitches in the middle of the fabric. Overall, the stitches were still slightly too tight, but the end result came out well. It’s definitely something I will wear when it gets a little colder.

Kitty hat

I’ve added lots of knitting project ideas to my ever-growing project list. I want to try combining conductive yarn and Fair Isle knitting to make functional and attractive knit circuits. Of course, there are lots of great non-technical projects in there too, like these Dalek mitts.

Knitting on a train
Knitting on a train

And, by the way, did you know that knitting is good for your health? Sources say that it is an excellent stress reliever and could possibly have the same effect as meditation.  I’ve definitely found myself getting lost in the motions of moving the needles.

GPS Clock Upgrade

Ice Tube Clock

Today I upgraded my Adafruit Ice Tube clock with a GPS module. The clock is beautiful but I found myself frustrated by having to continually update the time as the clock would slowly get out of sync. Fortunately, there is a handy guide on how to add a GPS module to the clock so that it can readjust the time based on GPS. It only took a few minutes to do the entire upgrade.

Clock and GPS

For the GPS module, you can use any 5 volt GPS module with 4800 baud TTL NMEA output. I chose the Parallax PMB-648 as it is relatively low cost and fits the specification perfectly. Once you have the GPS, it’s merely a question of disassembling the clock and soldering the GPS to the clock.

Solder Time

The next step is to reprogram the clock with the new firmware. You will need a 6 pin AVR programmer for this. I used Adafruit’s USBtinyISP AVR programmer. Make sure you have AVRDUDE set up correctly. With the correct environment, it is simply an issue of pushing the new firmware that supports GPS timekeeping.

IMG_9030

And that’s it. Just reassemble the clock and case and you are done. It was really cool to turn the clock back on and have it automatically adjust to the correct time. Now I don’t have to keep resetting the clock 🙂

Pulse Jacket

led_image_2 01

This was one of my first Arduino projects. After some near misses with bicyclists while running at night, I decided to get some lights so people could see me in the dark. But why stop at boring plain lights? Wouldn’t it be cool if they could respond to my heart rate?

I looked at a number of existing heart rate sensors for Arduino, but most were optical and could not get accurate readings while I was running since they were constantly being jarred. Since I run with a Garmin GPS watch and heart rate monitor, I tried to hack into the information being sent between the heart rate monitor and the Garmin watch.

Reading a bit more about the technology, I learned that Garmin used the ANT protocol for communication between the watch and heart rate band. The good news was that SparkFun made an ANT transceiver breakout board. The bad news was that the board was discontinued and I could only get my hands on one board. I decided to move forward with this board for prototyping knowing that I would need to come up with a different solution when I made the final project.

The first step was to get the Garmin heart rate monitor and an Arduino communicating with each other. The ANT protocol documents are pretty thorough and they make great bedtime reading. Fortunately for those of us who are impatient, this thread on the SparkFun forums has sample code that already implements the protocol for the Garmin heart rate monitor.

Microcontroller with ANT breakout board

Now that I had the pulse rate information, it was time to add lights. I am a huge fan of Adafruit’s LED strips. These strips have weatherproofing so it would be possible to run outside in the rain. I trimmed the strips to the length of my arms and sealed the ends.

Microcontroller with lights

I added seven different light modes which increased in speed with the heart rate: rainbow, raindrop, range pulse, color shot, twinkle, circulatory and Cylon. Most of these modes are self-explanatory. The range pulse mode faded the strips in time with the pulse and also chose the color based on the current pulse rate (blue being low pulse, red being high). Here you can see a quick demo of the seven modes:

I then began building the final version. For this, I chose to use a Teensy 2.0 because of its low price and small size. I also had to revisit the ANT transceiver. Searching around, I found this ANTAP281M5IB  module with an on-board antenna. After some very delicate wiring and soldering, this proved to be a direct replacement for the SparkFun board.

IMG_8863

Once everything was working, it was time to put this into a portable package for running. The main concern was power. After a bit of research, I found these Energizer power packs that I could plug directly into the Teensy. The one amp power pack would power both LED strips for about an hour. After verifying that everything still worked, I placed the assembled project into a small project box.

IMG_8862

The last issue was how to attach the LED strips to my arms. I thought about embedding them into a jacket by sewing them in, but I decided against that as it would be a pain to clean. Finally, I just glued some cable clips to the back of the LED strips and used velcro straps to adjust them for the right fit.

Assembling the arm supports
Assembled Jacket

And after all that we were ready to go! My first real-world test was the Midnight Run in Central Park on New Years Eve 2013.

New Years Eve - 2013

And now I can easily be seen in the dark!